What is a Exponential Moving Average?
📊 A Exponential Moving Average
An Exponential Moving Average (EMA) is a type of moving average that gives more weight to the most recent price data. Unlike a Simple Moving Average (SMA), which gives equal weight to each data point in the calculation, an EMA places a greater emphasis on recent price action.
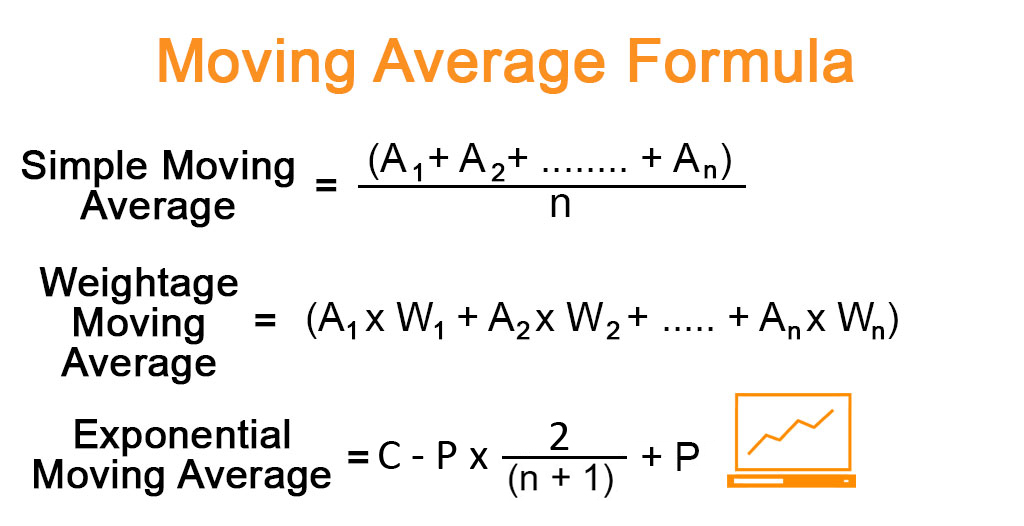
The calculation of an EMA involves using a smoothing factor, which assigns a weight to each data point based on its position in the series. The most recent data points are given the highest weight, while older data points are given progressively less weight. The formula for calculating an EMA is:
EMA = (Price - EMA previous day) x (2 / n + 1) + EMA previous day
where:
Price = current price
EMA previous day = the previous day`s EMA value
n = the number of periods in the EMA calculation
As the formula shows, the EMA calculation incorporates the previous day`s EMA value, which means that the EMA calculation is a recursive process. The smoothing factor, 2 / n + 1, determines the weight assigned to each data point, with a higher weight given to more recent data.
EMAs are often used by traders and investors to identify short-term trends and potential trading opportunities. A shorter-term EMA, such as a 20-day EMA, may be used to identify short-term trends, while a longer-term EMA, such as a 50-day or 200-day EMA, may be used to identify longer-term trends.
Like SMAs, EMAs can also be used in combination with other technical indicators to generate trading signals. For example, a bullish signal may be generated when the price of a security crosses above its EMA, while a bearish signal may be generated when the price crosses below its EMA.