What is Volume in Stock Market?
📊 Volume in Stock Market
Volume in the stock market refers to the total number of shares or contracts traded in a particular security over a specific period of time, such as a day or a week. It is a measure of market activity and liquidity, and can be used by traders and investors to analyze the strength or weakness of a trend.
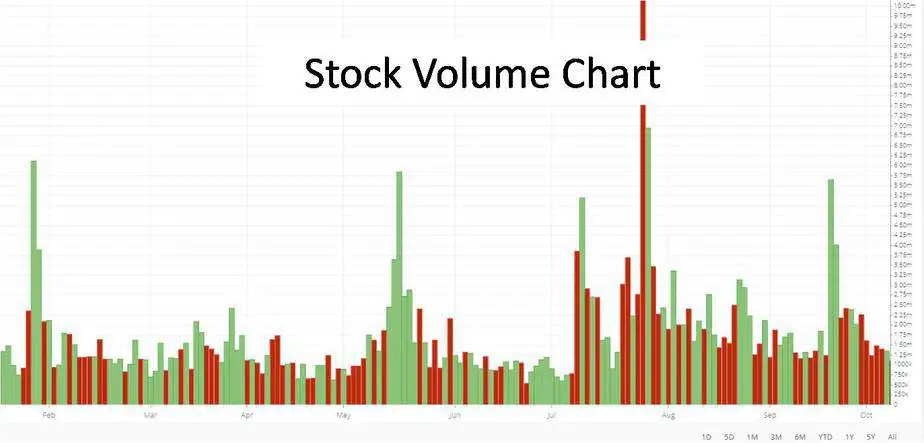
Volume is typically displayed on a chart as a histogram or bar graph below the price chart. The height of each bar represents the total number of shares or contracts traded during that period, with higher bars indicating higher trading activity.
Volume is an important tool for technical analysis because it can help confirm or contradict price movements. For example, if a stock is rising on high volume, it suggests that there is strong buying interest and the trend is likely to continue. Conversely, if a stock is falling on high volume, it suggests that there is strong selling pressure and the trend may reverse.
In addition to analyzing volume on its own, traders often use volume in conjunction with other technical indicators, such as moving averages or trendlines, to confirm signals and identify trading opportunities.